
library(readr)
data <- read_csv("data.csv")
data <- as.data.frame(data)
row.names(data) <- data$stock
dataStock Return and Fundamental Clustering & Portfolio Selection
Better portfolio management & optimization with machine learning / clustering
Introduction
We have following features for BIST30 stocks:
-
Momentum 3-months, 6-months, 1-year
-
Volatility 1-year, 2-year, 3-year
-
Price-To-Book Ratio
-
Market Capitalization
-
Return On Equity
-
Earnings Growth
We need to standardize the features:
```{r}
library(scales)

cols <- 5:ncol(data)

data_scaled <- lapply(data[, cols], function(x) if(is.numeric(x)) rescale(x, to=c(0,1)) else x)
data_scaled <- as.data.frame(data_scaled)
data_scaled <- cbind(data[,1:4], data_scaled)
row.names(data_scaled) <- data_scaled$stock
data_scaled$stock <- NULL
data_scaled
```
Earnings Growth column has NA values, replace NA’s with zero:
data_scaled$earningsGrowth[is.na(data_scaled$earningsGrowth)] <- 0We will use K-means method. Let’s calculate silhouette score for optimal cluster count:
library(factoextra)
library(cluster)

fviz_nbclust(data_scaled, kmeans, method = "silhouette", k.max = 10)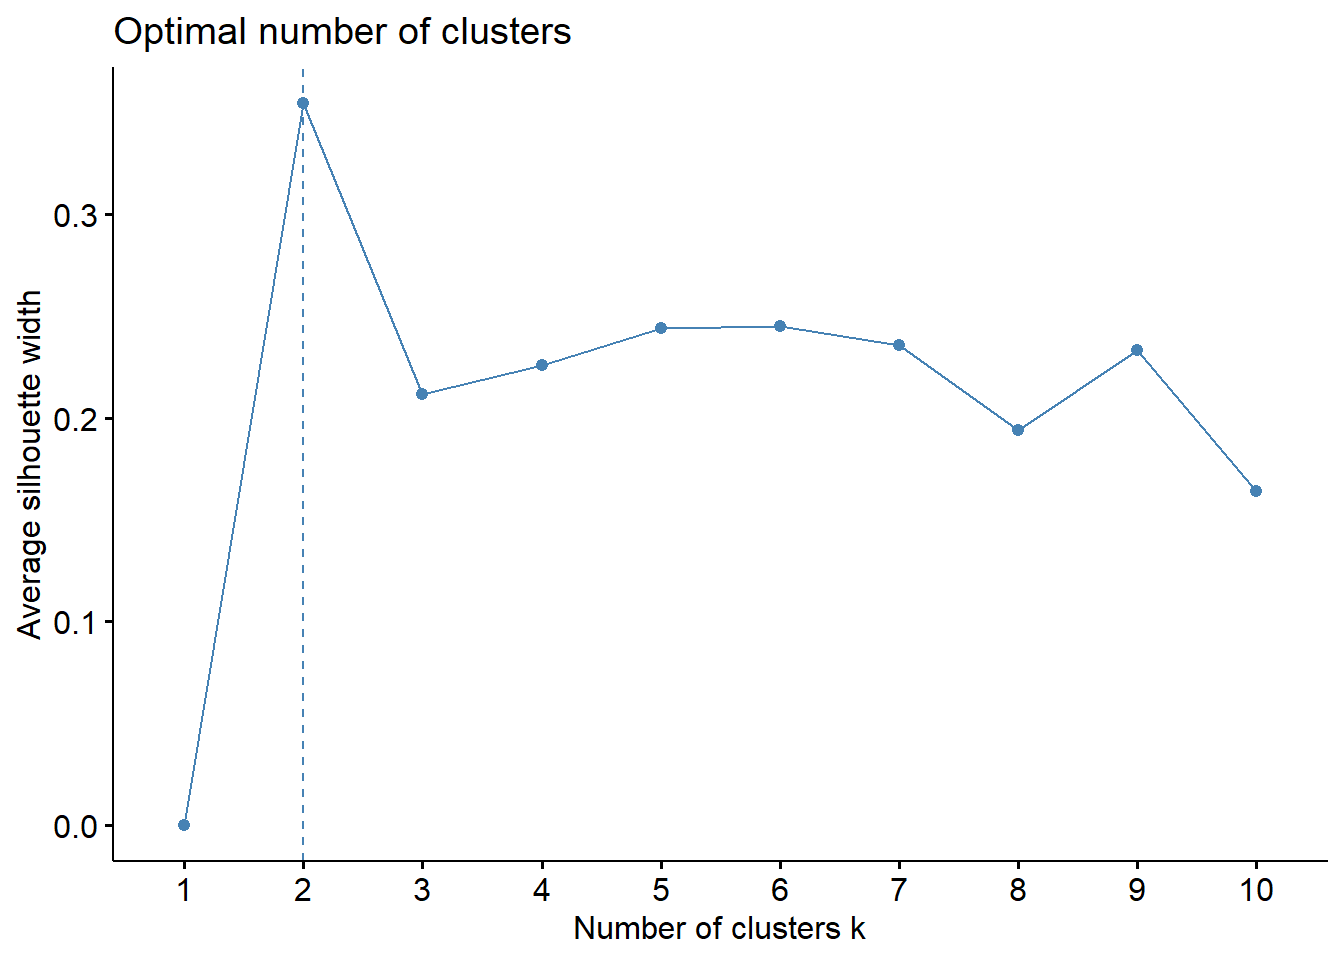
We have two different clusters, let’s fit model and see results:
model <- kmeans(data_scaled, 2)
fviz_cluster(object = model,
             data = data_scaled,
             ellipse.type = "norm",
             geom = "text",
             palette = "jco",
             main = "",
             ggtheme = theme_minimal())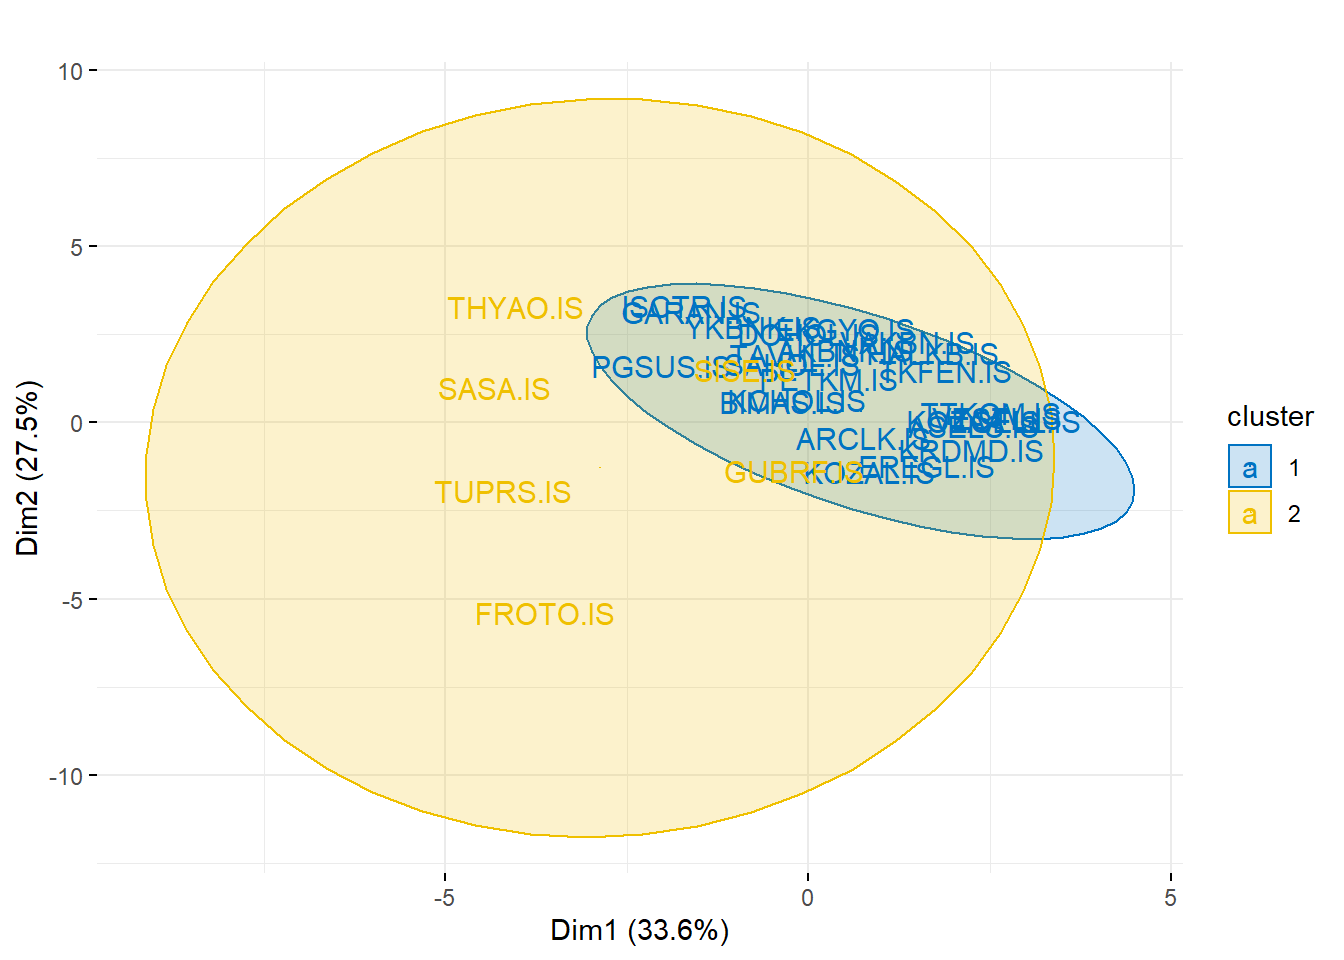
Statistics:
modelK-means clustering with 2 clusters of sizes 24, 6
Cluster means:
return1y return2y return3y momentum_3m momentum_6m momentum_1y
1 0.5021594 0.6856488 0.9261702 0.5014242 0.4282937 0.3035298
2 0.6812538 1.2212164 1.8785916 0.5867881 0.5896588 0.4708884
volatility_1y volatility_2y volatility_3y priceToBook marketCap
1 0.1032558 0.0909333 0.07866424 0.03512632 0.3220344
2 0.4404008 0.4355551 0.39217887 0.34549470 0.6317486
returnOnEquity earningsGrowth
1 0.3900359 0.1203581
2 0.5562222 0.2889656
Clustering vector:
TUPRS.IS VAKBN.IS KRDMD.IS DOHOL.IS AKBNK.IS TKFEN.IS FROTO.IS GARAN.IS
2 1 1 1 1 1 2 1
KOZAA.IS HALKB.IS TCELL.IS KOZAL.IS VESTL.IS YKBNK.IS TTKOM.IS BIMAS.IS
1 1 1 1 1 1 1 1
PETKM.IS ARCLK.IS EREGL.IS SAHOL.IS EKGYO.IS THYAO.IS PGSUS.IS ISCTR.IS
1 1 1 1 1 2 1 1
KCHOL.IS ASELS.IS TAVHL.IS GUBRF.IS SISE.IS SASA.IS
1 1 1 2 2 2
Within cluster sum of squares by cluster:
[1] 14.45341 10.20335
(between_SS / total_SS = 26.7 %)
Available components:
[1] "cluster" "centers" "totss" "withinss" "tot.withinss"
[6] "betweenss" "size" "iter" "ifault" sil <- silhouette(model$cluster, dist(data_scaled))
fviz_silhouette(sil, palette = "jco", ggtheme = theme_classic()) cluster size ave.sil.width
1 1 24 0.45
2 2 6 -0.02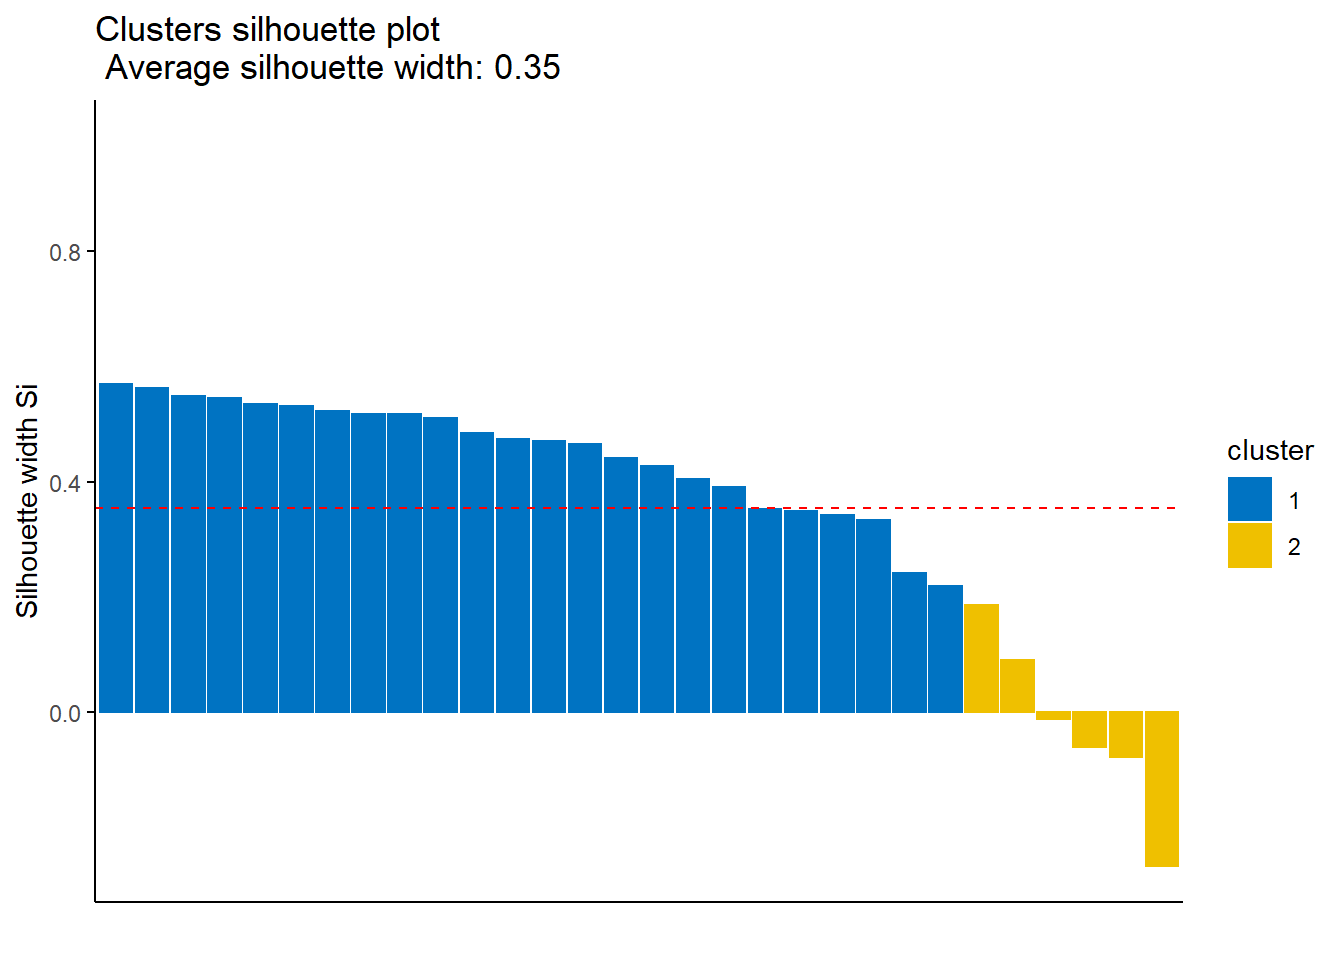
There are negative silhouette scores, it indicates that it may be in the wrong cluster.
Let’s look the mean return statistics of each cluster:
library(dplyr)

predicted_clusters <- data.frame(predicted_cluster=model$cluster, row.names=names(model$cluster))
data_clustered <- merge(data, predicted_clusters, by=0)

data_clustered %>%
  group_by(predicted_cluster) %>%
  summarise(
    mean_1_year_return = mean(return1y),
    std_1_year_return = sd(return1y),
    mean_2_year_return = mean(return2y),
    std_2_year_return = sd(return2y),
    mean_3_year_return = mean(return3y),
    std_3_year_return = sd(return3y),
    )
Full source code: https://github.com/mrtkp9993/MyDsProjects/tree/main/StockClustering
References
\(^1\) https://www.investopedia.com/terms/c/cluster_analysis.asp
\(^2\) https://www.investopedia.com/terms/f/factor-investing.asp
No matching items
Citation
BibTeX citation:
@online{koptur2022,
  author = {Koptur, Murat},
  title = {Stock {Return} and {Fundamental} {Clustering} \& {Portfolio}
    {Selection}},
  date = {2022-08-26},
  url = {https://muratkoptur.com/MyDsProjects/StockClustering/Analysis},
  langid = {en}
}
For attribution, please cite this work as:
Koptur, Murat. 2022. “Stock Return and Fundamental Clustering
& Portfolio Selection.” August 26, 2022. https://muratkoptur.com/MyDsProjects/StockClustering/Analysis.