Volume Profile: A tool for Market Insight
Introduction
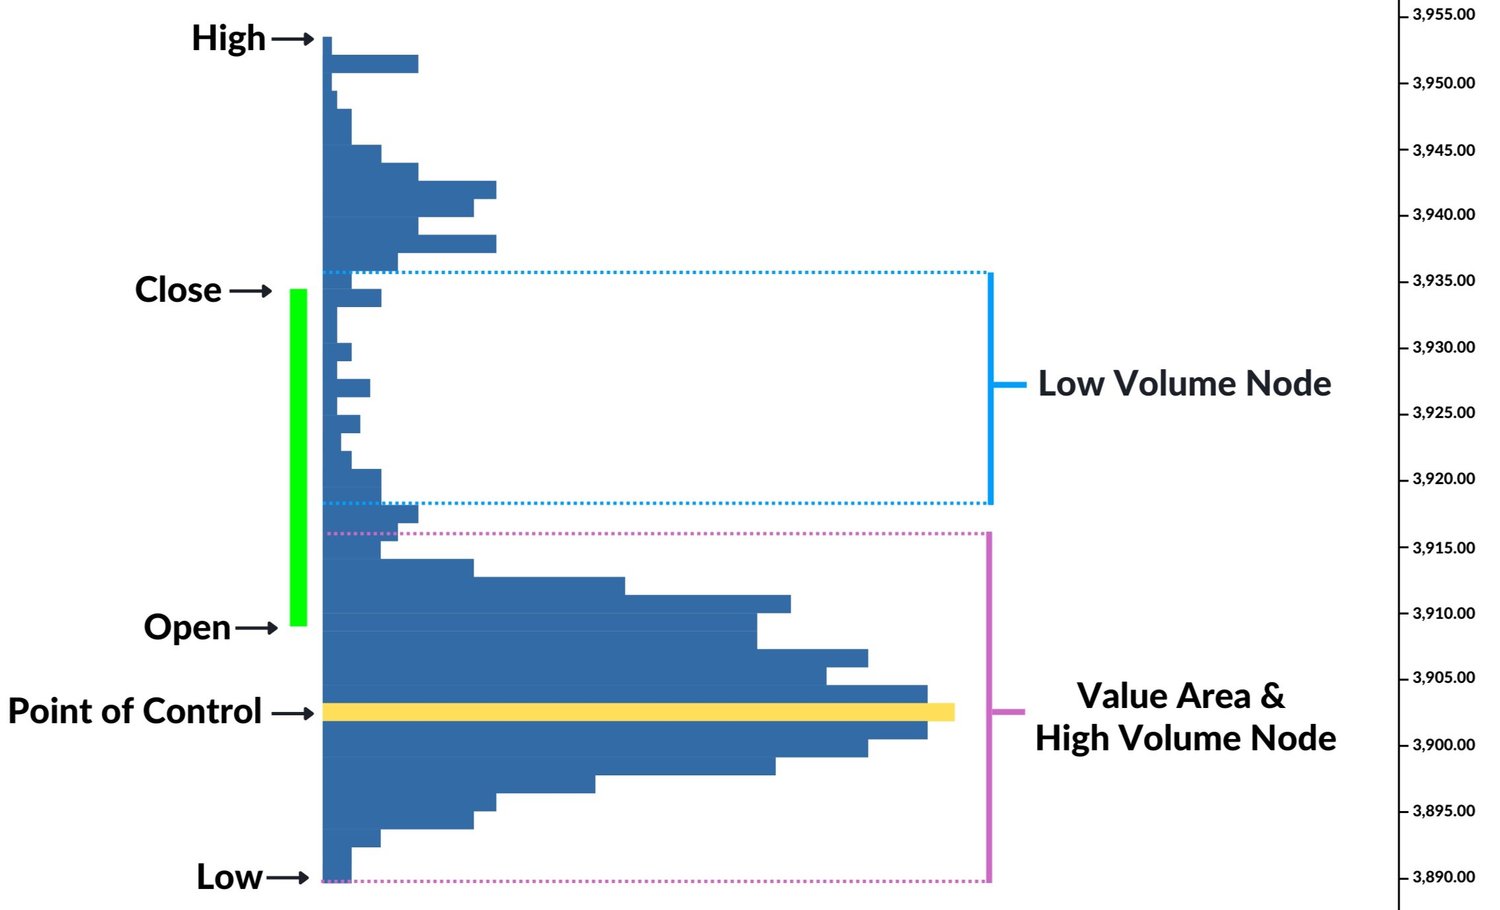
The volume profile is an essential tool for traders, providing a visual snapshot of trading activity at different price levels over a given period. This advanced charting technique is not just about tracking the volume of trades but also about understanding the market’s behavior and identifying important trading levels.
Fundamentally, the volume profile highlights where most trading activity has taken place, allowing traders to identify areas of high and low volume. These are referred to as High Volume Nodes (HVNs) and Low Volume Nodes (LVNs). HVNs indicate price levels with substantial market interest, often acting as potential support or resistance zones. On the other hand, LVNs mark price levels with limited trading activity, which could suggest a potential price breakout or rejection.
 Source: https://opinicusholdings.com/options-trading-blog/mastering-volume-profiles-a-guide-for-traders
One of the components of the volume profile is the Point of Control (POC), the price level with the most trading volume during the session. The POC serves as a focal point for traders, as it often acts as a magnet for future price action, reflecting the market’s consensus value for the asset.
The Value Area extends from the POC, covering a range where a specified percentage of the session’s volume has occurred, typically around 70%. This area represents fair value, where traders are most willing to conduct transactions. Prices outside this range are considered to be either overvalued or undervalued, depending on their position relative to the Value Area.
The volume profile is not a standalone indicator; it is most effective when combined with other forms of analysis, such as technical indicators or fundamental analysis. It provides context to the price action, allowing traders to make more informed decisions based on the underlying market structure.
Calculating Volume Profile
Using tradesly’s free Fibonacci Retracement and Volume Profile Calculator, we can quickly calculate volume profile for any financial instrument which we want.
Let’s examine the volume profiles calculated from 1-hour period daily data for THYAO.IS and SAHOL.IS stocks at September 6, 2024 4:09 UTC+3.
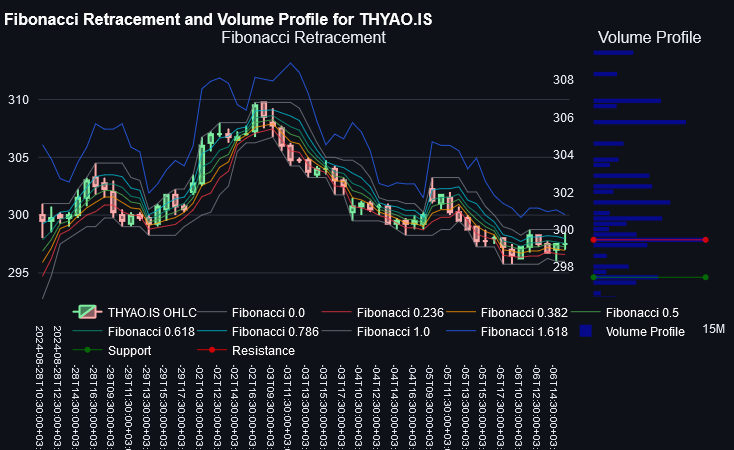
For THYAO.IS, the analysis revealed a support level at 297.5 TRY and a resistance level at 299.5 TRY.
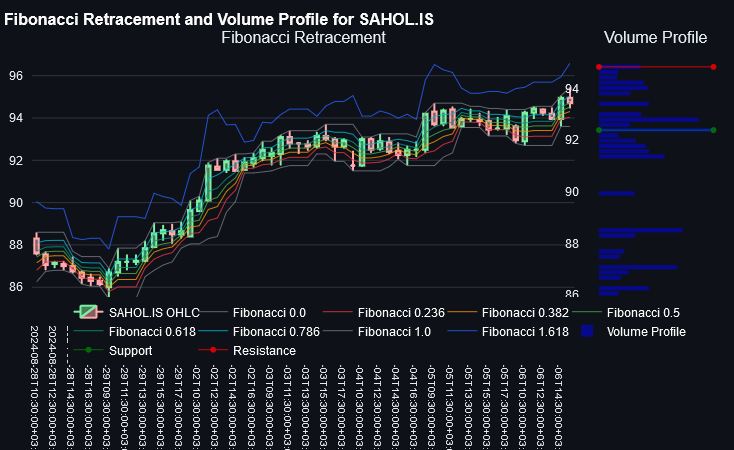
For SAHOL.IS, the analysis identified a support level at 92.4 TRY and a resistance level at 94.8 TRY.
Now, let’s investigate what happened 2 hours later.
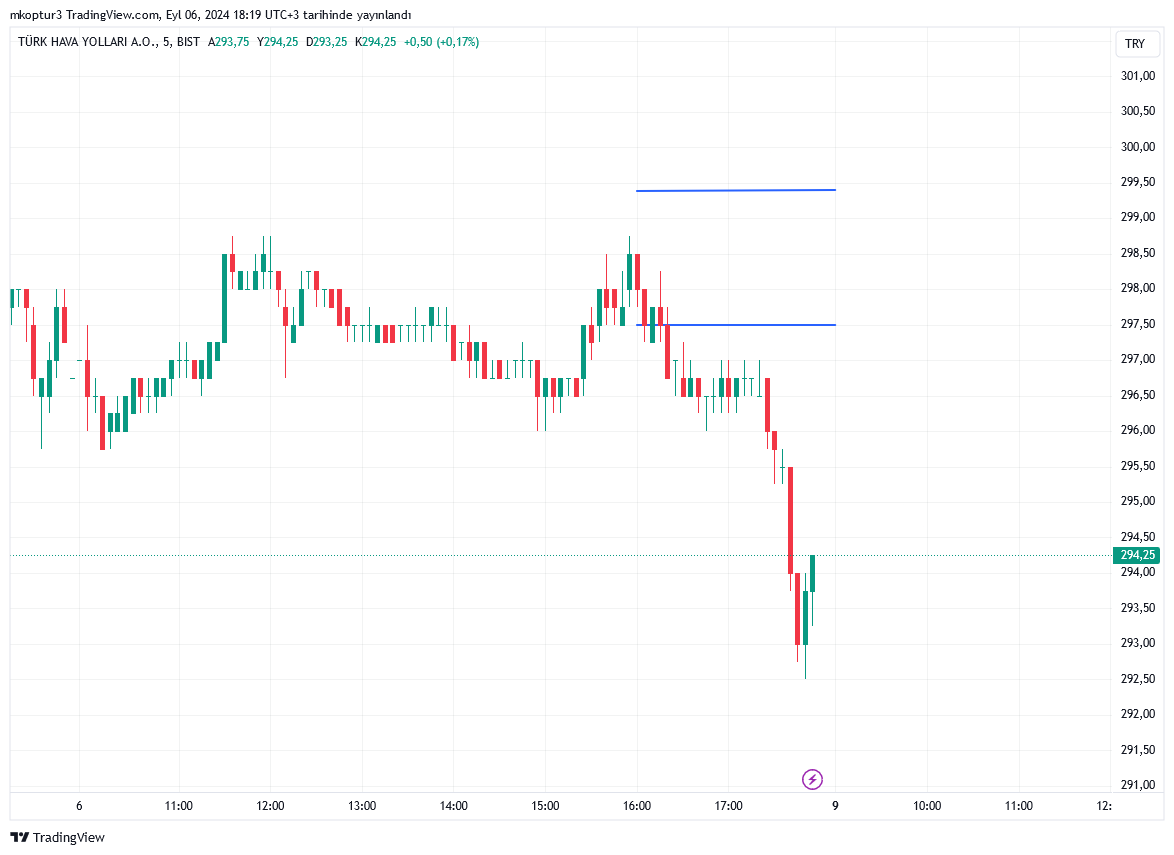
THYAO.IS broke support at 297.5 TRY, with the price falling sharply to 294.25 TRY. This breakdown suggests increased selling pressure and potentially bearish sentiment towards the stock. When a support level is breached, it often indicates that sellers have overwhelmed buyers at that price point. This move could signal a shift in market dynamics for THYAO.IS, possibly due to company-specific factors, broader market trends, or changes in the industry outlook.
It’s important to note that these sudden price drops could be due to various factors such as market-wide events, company-specific news, or large institutional trades. Further context about any relevant news or broader market movements would be helpful for a more comprehensive analysis.
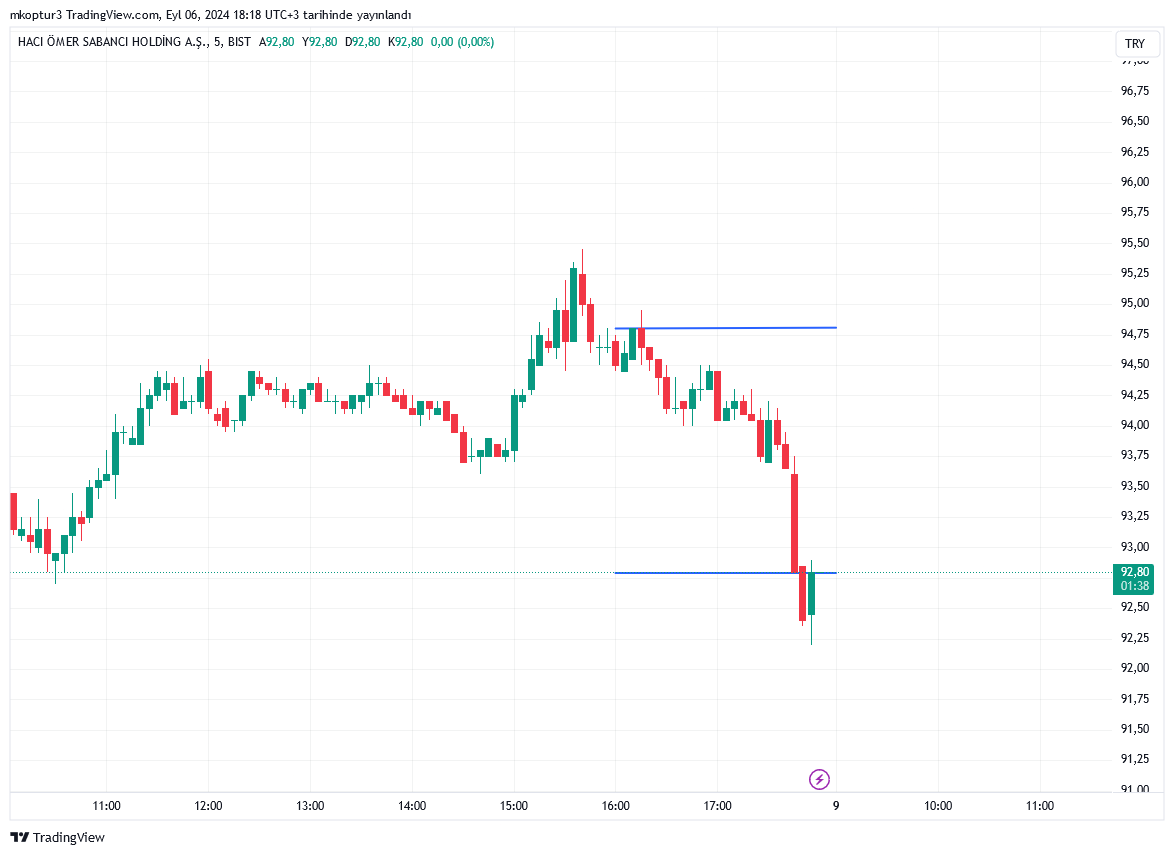
SAHOL.IS was trading within its established range, successfully maintaining its position above the support level of 92.4 TRY while not reaching the resistance at 94.8 TRY. The stock’s current price of 92.80 TRY indicates a resilience to downward pressure, at least in the short term. The stock’s ability to hold above support could be interpreted as a sign of stability or even potential bullish sentiment among investors. However, it’s important to note that SAHOL.IS is still trading closer to its support than its resistance, which may indicate some underlying market caution. Traders and investors might be watching closely to see if the stock can gather momentum to test the resistance level, or if it will continue to consolidate near the current price range.
For both stocks, the volume profile data provides important reference points for potential price reactions.
For more information about our robo-advisor apps, you can visit tradesly AI Robo-advisor website or check out the app on tradesly AI Robo-advisor Google Play.